 EMODnet Product Catalogue
Ifremer, Deep Environment Laboratory
Type of resources
Available actions
Topics
Keywords
Contact for the resource
Provided by
Years
Formats
Representation types
Resolution
-
Water body dissolved oxygen concentration - Monthly Climatology for the European Seas for the period 1960-2020 on the domain from longitude -45.0 to 70.0 degrees East and latitude 24.0 to 83.0 degrees North. Data Sources: observational data from SeaDataNet/EMODnet Chemistry Data Network. Description of DIVA analysis: The computation was done with the DIVAnd (Data-Interpolating Variational Analysis in n dimensions), version 2.7.9, using GEBCO 30sec topography for the spatial connectivity of water masses. Horizontal correlation length and vertical correlation length vary spatially depending on the topography and domain. Depth range: 0.0, 5.0, 10.0, 15.0, 20.0, 25.0, 30.0, 35.0, 40.0, 45.0, 50.0, 55.0, 60.0, 65.0, 70.0, 75.0, 80.0, 85.0, 90.0, 95.0, 100.0, 125.0, 150.0, 175.0, 200.0, 225.0, 250.0, 275.0, 300.0, 325.0, 350.0, 375.0, 400.0, 425.0, 450.0, 475.0, 500.0, 550.0, 600.0, 650.0, 700.0, 750.0, 800.0, 850.0, 900.0, 950.0, 1000.0, 1050.0, 1100.0, 1150.0, 1200.0, 1250.0, 1300.0, 1350.0, 1400.0, 1450.0, 1500.0, 1550.0, 1600.0, 1650.0, 1700.0, 1750.0, 1800.0, 1850.0, 1900.0, 1950.0, 2000.0, 2100.0, 2200.0, 2300.0, 2400.0, 2500.0, 2600.0, 2700.0, 2800.0, 2900.0, 3000.0, 3100.0, 3200.0, 3300.0, 3400.0, 3500.0, 3600.0, 3700.0, 3800.0, 3900.0, 4000.0, 4100.0, 4200.0, 4300.0, 4400.0, 4500.0, 4600.0, 4700.0, 4800.0, 4900.0, 5000.0, 5100.0, 5200.0, 5300.0, 5400.0, 5500.0 m. Units: umol/l. The horizontal resolution of the produced DIVAnd analysis is 0.25 degrees.
-
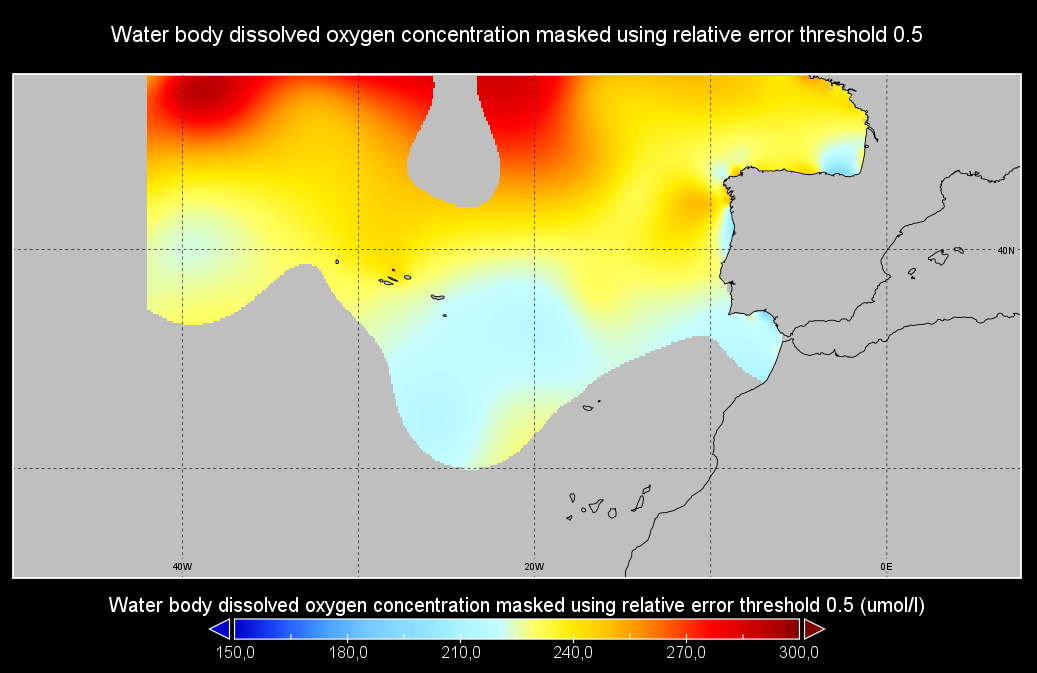
Moving 6-year analysis of Water body dissolved oxygen concentration in the NorthEast Atlantic for each season: - winter: January-March, - spring: April-June, - summer: July-September, - autumn: October-December. Every year of the time dimension corresponds to the 6-year centred average of each season. 6-year periods span from 1950/1955 until 2016/2021. Observation data span from 1950 to 2021. Depth levels (IODE standard depths): [0.0, 5.0, 10.0, 20.0, 30.0, 40.0, 50.0, 75.0, 100.0, 125.0, 150.0, 200.0, 250.0, 300.0, 400.0, 500.0, 600.0, 700.0, 800.0, 900.0, 1000.0, 1100.0, 1200.0, 1300.0, 1400.0, 1500.0, 1750.0, 2000.0, 2500.0, 3000.0]. Data sources: observational data from SeaDataNet/EMODNet Chemistry Data Network. Descrption of DIVAnd analysis: the computation was done with DIVAnd (Data-Interpolating Variational Analysis in n dimensions), version 2.7.4, using GEBCO 30 sec topography for the spatial connectivity of water masses. The horizontal resolution of the produced DIVAnd maps is 0.1 degrees. Horizontal correlation length varies from 400km in open sea regions to 50km at the coast. Vertical correlation length is defined as twice the vertical resolution. Signal-to-noise ratio was fixed to 1 for vertical profiles and 0.1 for time series to account for the redundancy in the time series observations.A logarithmic transformation (DIVAnd.Anam.loglin) was applied to the data prior to the analysis to avoid unrealistic negative values. Background field: a vertically-filtered profile of the seasonal data mean value (including all years) is substracted from the data. Detrending of data: no, advection constraint applied: no. Units: umol/l.
-
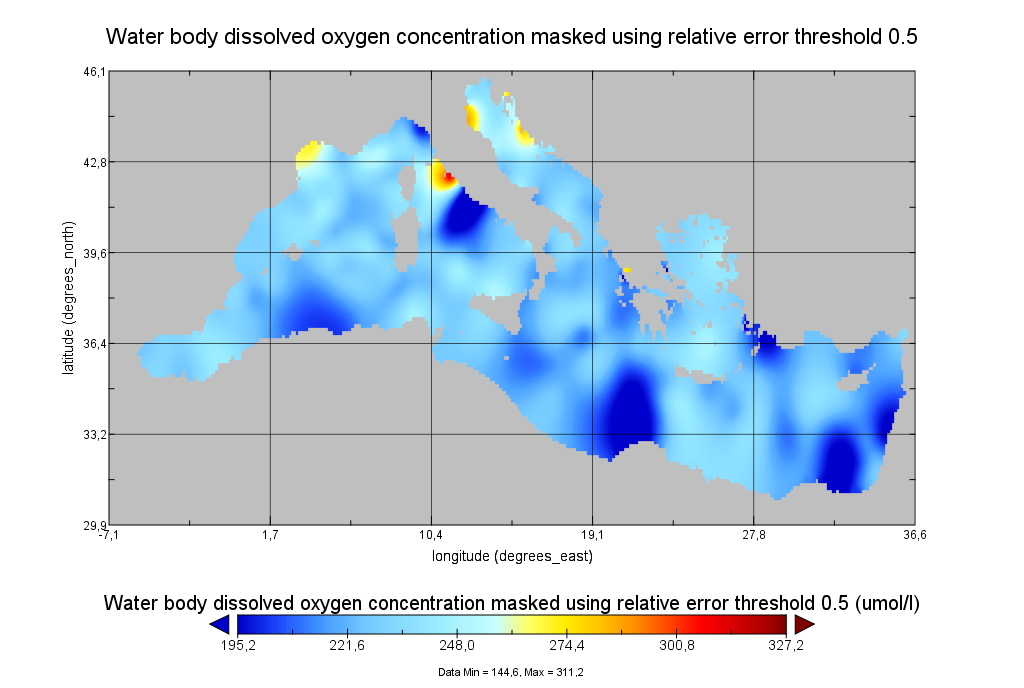
Moving 6-year analysis of Water body dissolved oxygen concentration in the Mediterranean Sea for each season: - winter: January-March, - spring: April-June, - summer: July-September, - autumn: October-December. Every year of the time dimension corresponds to the 6-year centered average of the season. 6-years periods span from 1971-1976 until 2017-2022. Data Sources: observational data from SeaDataNet/EMODNet Chemistry Data Network. Description of DIVA analysis: The computation was done with the DIVAnd (Data-Interpolating Variational Analysis in n dimensions), version 2.7.9, using GEBCO 30sec topography for the spatial connectivity of water masses. The horizontal resolution of the produced DIVAnd maps grids is dx=dy=0.125 degrees (around 13.5km and 10.9km accordingly). The vertical resolution is 27 depth levels: [0.,5.,10.,20.,30.,50.,75.,100.,125.,150.,200.,250.,300.,400.,500.,600.,700.,800.,900.,1000.,1100.,1200.,1300.,1400.,1500.,1750.,2000.]. The horizontal correlation length is 200km. The vertical correlation length (in meters) was set twices the vertical resolution: [10.,10.,20.,20.,40.,50.,50.,50.,50.,100.,100.,100.,200.,200.,200.,200.,200.,200.,200.,200.,200.,200.,200.,200.,500.,500.,500.]. Duplicates check was performed using the following criteria for space and time: dlon=0.001deg., dlat=0.001deg., ddepth=1m, dtime=1hour, dvalue=0.1. The error variance (epsilon2) was set equal to 1 for profiles and 10 for time series to reduce the influence of close data near the coasts. An anamorphosis transformation was applied to the data (function DIVAnd.Anam.loglin) to avoid unrealistic negative values: threshold value=200. A background analysis field was used for all years (1971-2022) with correlation length equal to 600km and error variance (epsilon2) equal to 20. Quality control of the observations was applied using the interpolated field (QCMETHOD=3). Residuals (differences between the observations and the analysis (interpolated linearly to the location of the observations) were calculated. Observations with residuals outside the minimum and maximum values of the 99% quantile were discarded from the analysis. Originators of Italian data sets-List of contributors: - Brunetti Fabio (OGS) - Cardin Vanessa, Bensi Manuel doi:10.6092/36728450-4296-4e6a-967d-d5b6da55f306 - Cardin Vanessa, Bensi Manuel, Ursella Laura, Siena Giuseppe doi:10.6092/f8e6d18e-f877-4aa5-a983-a03b06ccb987 - Cataletto Bruno (OGS) - Cinzia Comici Cinzia (OGS) - Civitarese Giuseppe (OGS) - DeVittor Cinzia (OGS) - Giani Michele (OGS) - Kovacevic Vedrana (OGS) - Mosetti Renzo (OGS) - Solidoro C.,Beran A.,Cataletto B.,Celussi M.,Cibic T.,Comici C.,Del Negro P.,De Vittor C.,Minocci M.,Monti M.,Fabbro C.,Falconi C.,Franzo A.,Libralato S.,Lipizer M.,Negussanti J.S.,Russel H.,Valli G., doi:10.6092/e5518899-b914-43b0-8139-023718aa63f5 - Celio Massimo (ARPA FVG) - Malaguti Antonella (ENEA) - Fonda Umani Serena (UNITS) - Bignami Francesco (ISAC/CNR) - Boldrini Alfredo (ISMAR/CNR) - Marini Mauro (ISMAR/CNR) - Miserocchi Stefano (ISMAR/CNR) - Zaccone Renata (IAMC/CNR) - Lavezza, R., Dubroca, L. F. C., Ludicone, D., Kress, N., Herut, B., Civitarese, G., Cruzado, A., Lefèvre, D.,Souvermezoglou, E., Yilmaz, A., Tugrul, S., and Ribera d'Alcala, M.: Compilation of quality controlled nutrient profiles from the Mediterranean Sea, doi:10.1594/PANGAEA.771907, 2011.
-
This dataset contains temperature data acquired between April 2015 and September 2016 using16 thermocrons i-buttons © installed along chains in the field of view of the SMOOVE camera connected the SeaMoN East frame. Data was acquired every 2 hours. The array is not connected to an energy node. They are associated with the SMOOVE camera which is part of the SeaMoN East ecological monitoring node.
-
This dataset contains acoustic signal acquired between July 2017 and August 2018 on EMSO-Azores observatory by the EGIM. Acoustic signal is one of the 7 core parameters monitored by the EGIM, EMSO Generic Instrumental Module. The EGIM prototype was deployed at Lucky Strike hydrothermal vent site, 25 m south west of the active edifice Tour Eiffel, to monitor local hydrodynamic variability and complement the data obtained by the numerous sensors set on this site: oceanographic mooring deployed south of the vent field, the multidisciplinary Seamon East node, autonomous current meters, array of temperature probes…
-
This dataset contains temperature data acquired between July 2014 and April 2015 using15 thermocrons i-buttons © installed along chains in the field of view of the SMOOVE camera connected the SeaMoN East frame. Data was acquired every hour. The array is not connected to an energy node. They are associated with the SMOOVE camera which is part of the SeaMoN East ecological monitoring node.
-
This dataset contains conductivity, temperature and pressure data acquired between July 2017 and August 2018 on EMSO-Azores observatory by the EGIM. These are 3 of the 7 core parameters monitored by the EGIM, EMSO Generic Instrumental Module. The EGIM prototype was deployed at Lucky Strike hydrothermal vent site, 25 m south west of the active edifice Tour Eiffel, to monitor local hydrodynamic variability and complement the data obtained by the numerous sensors set on this site: oceanographic mooring deployed south of the vent field, the multidisciplinary Seamon East node, autonomous current meters, array of temperature probes…
-
This dataset contains temperature data acquired between 7 September 2016 and February 2017 using hundred ONE_WIRE_DS18B20S (Maxim IC) sensors installed along a 70 m chain. Sensors are located on the last 50 m of the chain, each separated by 50 cm. The chain is connected to the SeaMoN East frame which is part of the SeaMoN East ecological monitoring node. Data was acquired every five minutes. The chain suffered a malfunction starting in January 2017. Data was cleaned for obvious outliers (temperature > 84°C or < 4°C). Data from 18 to 21 January 2017 should be considered with caution. Data after 21 January 2017 were removed.
-
This dataset contains temperature (°C) and dissolved oxygen concentrations (µmol/l) (and the associated sensor raw data) acquired between September 2016 and February 2017 using an Aanderaa optode (model 4330, sensor head #2133, salinity setting 3.5%, uncorrected for pressure) The sensor. The sensor was positioned on a mussel bed at the base of the Tour Eiffel edifice (1695m depth). Data was acquired every 15 minutes. A two-point calibration at 0% and 100% saturation levels is performed at each maintenance cruise. The optode connected to the TEMPO ecological module is part of the SeaMoN East monitoring node.
-
This dataset contains temperature data acquired between September 2016 and July 2017 using 10 thermocrons i-buttons © installed along chains in the field of view of the SMOOVE camera connected the SeaMoN East frame. Data was acquired every hour. The array is not connected to an energy node. They are associated with the SMOOVE camera which is part of the SeaMoN East ecological monitoring node.